
Key Highlights
- Bitcoin failed to settle above $80,000 and started a consolidation phase.
- A bullish trend line is forming with support at $77,400 on the 4-hour chart of BTC/USD.
- Ethereum could eye a fresh surge if it closes above $2,550.
- Gold retreated from highs and corrected below $4,520.
Bitcoin Price Technical Analysis
Bitcoin price spiked above $80,000 before it faced sellers against the US Dollar but failed. BTC formed a high at $81,465 and started a consolidation phase.
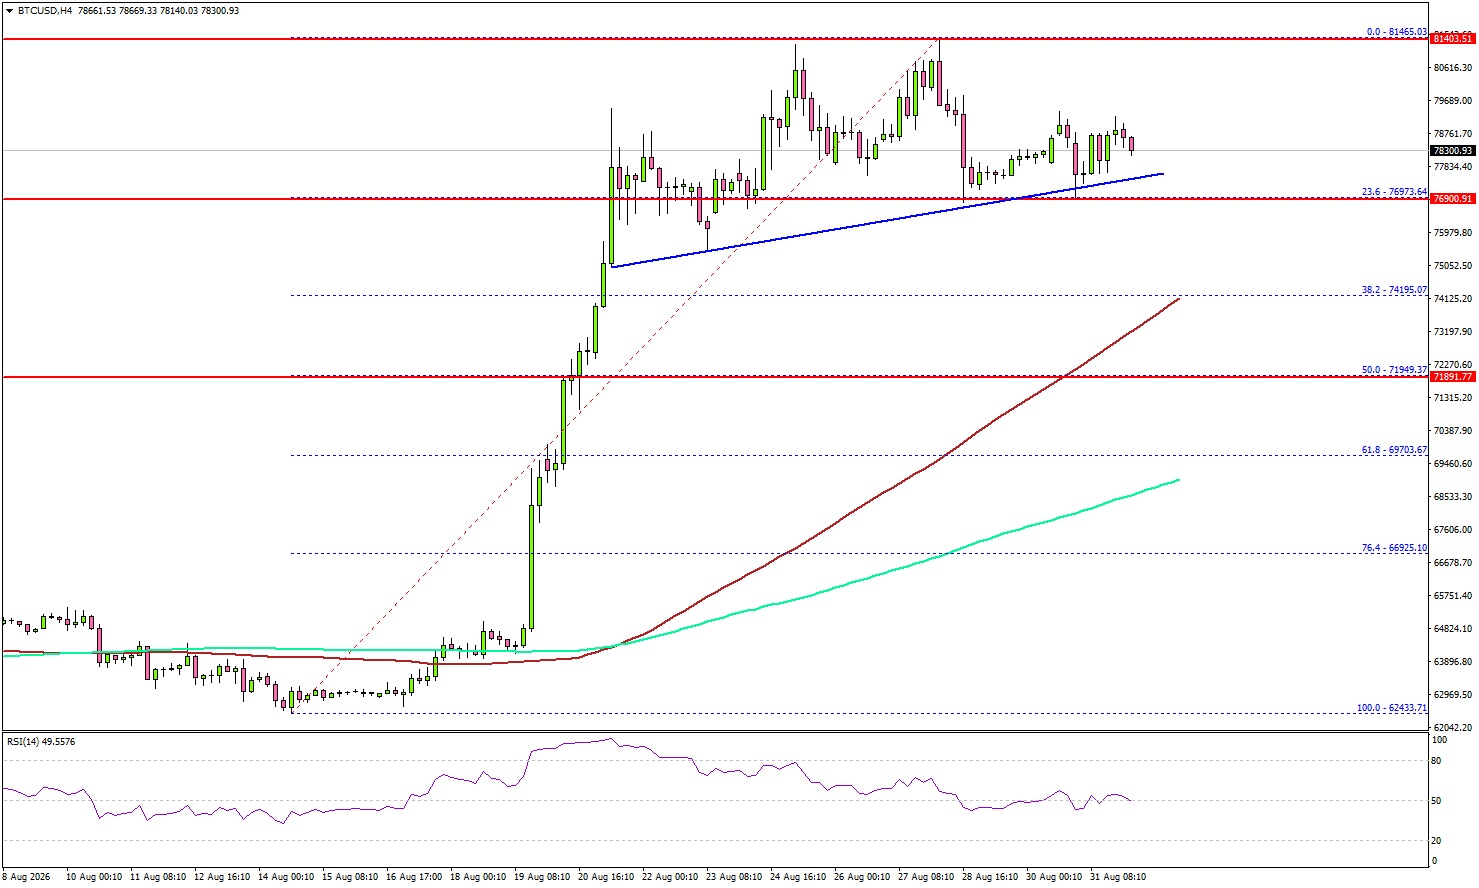
Looking at the 4-hour chart, the price dipped below $80,000 and $79,500. There was a dip to test the 23.6% Fib retracement level of the upward move from the $62,433 swing low to the $81,465 high. However, BTC remained stable above the 100 simple moving average (red, 4-hour) and the 200 simple moving average (green, 4-hour).
On the upside, an immediate resistance could be $79,500. The first major resistance might be $80,000. The main resistance might be $81,500. A close above $81,500 could send the price toward $83,800. Any further gain might call for a test of $85,000.
If the price dips further, it could slide below $76,800. The first major support might be $75,500. A downside break and close below $75,500 could trigger a sharp decline. In the stated scenario, the price could test $74,000 and the 100 simple moving average (red, 4-hour).
The main support might be near the 50% Fib retracement level at $71,950, below which the bears could even aim for a move below $70,000.
Looking at Ethereum, the price is also consolidating gains and might aim for another leg up if there is a close above $2,550.
Today’s Key Economic Releases
- US S&P Global Manufacturing PMI for August 2026 – Forecast 53.2, versus 53.2 previous.
- US ISM Manufacturing Index for August 2026 – Forecast 55.2, versus 55.6 previous.
SOURCE LINK : Bitcoin Faces a Key Resistance Test as Consolidation Continues